On a recent crossing from Portsmouth to Honfleur I was interested to see how significant the error was between our actual GPS position and that recorded in the logbook using time & distance covered through the water by dead reckoning or estimated position. If our GPS had completely failed and we hadn’t recorded fixes every hour (heaven forbid) then all we’d have to go on would be distance travelled through water, course steered and tidal set/drift to mark up our estimated position.
Read the blog on how to determine course to steer and navigate across the English Channel
Recording fixes in the logbook
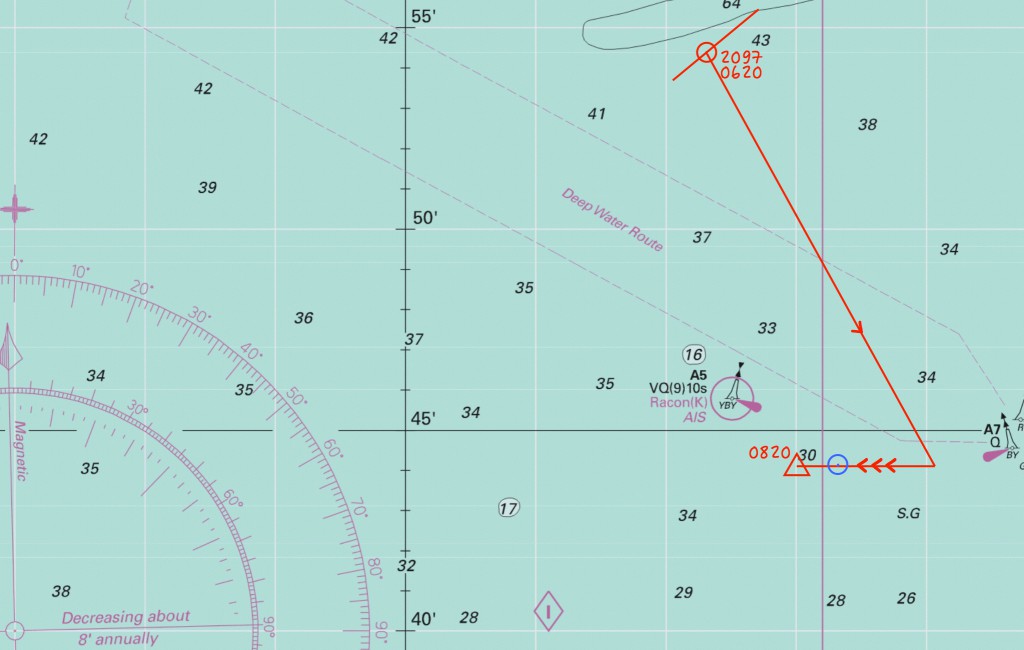
On a long crossing I always find it easier to log position using a range and bearing from the centre of a compass rose on the paper chart. It’s easier to read from the GPS, quicker to write down in the log book [eg “CR2 263/21.1”], it’s less error prone to plot on the chart and the crew can usually help out too. If you’re at all prone to seasickness then transposing lat/long coordinates to the chart requires more head down concentration than a simple line and range, and so is to be avoided.
You just have to be very careful to enter the lat/long of the compass roses correctly – I checked range & bearing on the chart before setting off from Gosport marina. You can also lock them in the chart plotter so no one accidentally edits them. And if you’re tempted only to record in the logbook and not on the chart you’ll miss out on the big picture of your progress over time – see how this let me down on my first skippered crossing. Of course, if you have a chart plotter (we didn’t in 2012) and you’ve switched on tracking you could opt not to plot on the paper chart – but I like to.
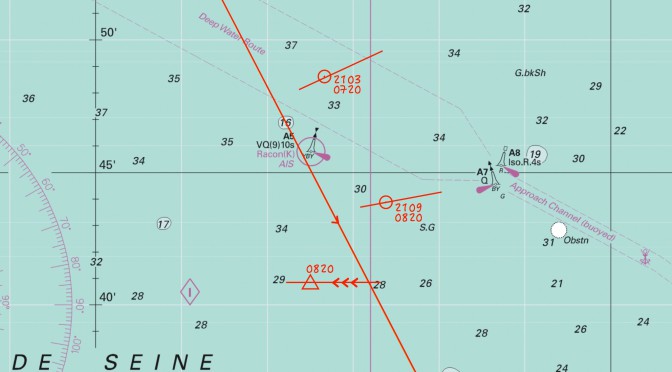
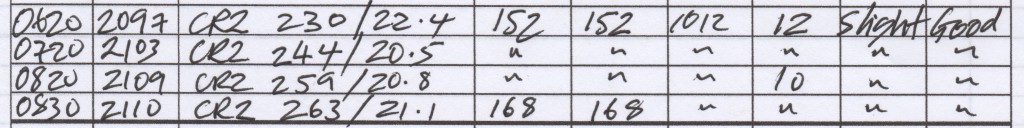
After about 12 hours of sailing on a CTS of 152 we logged & plotted the position shown on the chart below – it’s shown as 2109 logged miles at 0820 in the morning. We were doing this every hour – you can see the previous one at 0720 some 6 miles earlier. So we know this was our actual position at that time – range 20.8 miles bearing 259T from compass rose 2. The short line shows what was drawn using the ruler from the rose and then intersected with the dividers and marked with a dot & circle (as it’s a fix).
Estimated position after 12 hours
The main orange line is the course steered converted to true (152M less 1° magnetic variation, no deviation, no leeway on a broad reach). I then marked off 68 miles from Bembridge Ledge ECM which we recorded in the logbook at 2030 the previous evening with a log of 2041.
The total net tidal drift for those 12½ hours was 2.4 miles west so that’s the small line with the 3 arrows on it (if you want to see how to work this out have a look at Navigating the English Channel). The end point on this line is our estimated position (a dot with triangle around it).
Measuring the difference between the fix and the estimated position shows an error of 4.9 miles. Not bad after 12 hours of sailing – when, as pointed out by Jim in a comment on my earlier post, that 1° of steering error over 60 miles will give you a 1 mile error. We had also gybed & tacked a few times during the night to avoid traffic which isn’t accounted for here.
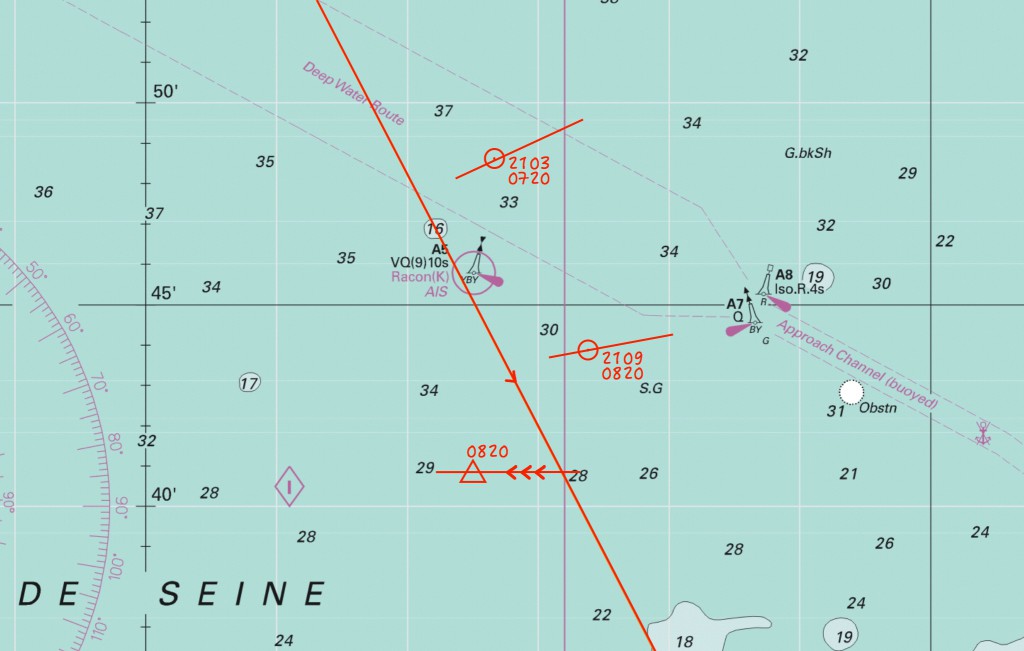
A realistic scenario – estimated position after 2 hours
All this is rather academic really, since you would always work up an EP from the last known position which, if the GPS had failed, would have been from the 0720 plot. But it does illustrate that the “circle of uncertainty” from the EP is quite large – at least 4 miles.
Let’s imagine that we’d been recording our position in the log every hour but forgotten to do the one at 0720. As you go down below to log at 0820 we notice the GPS is broken. The last fix in the logbook & on the chart was at 0620 – you kick yourself.
As above, the process would be to plot a line at 151T (152M less 1° variation, no compass deviation, no leeway on a broad reach) from the last fix for 12 miles (2109 at 0820 less 2097 at 0620). Then using the tides for those 2 hours plot a line 3.0 miles west and mark with an EP triangle. The blue circle (which we wouldn’t know of course) was our actual position at that time and the error can be seen to be 1 mile.
Interestingly, our actual position was bang on the tidal vector which would infer the tide wasn’t actually 3 miles but closer to 2. Or it could have been a steering error to port by a few degrees (5 degrees over 12 miles equates to a 1 mile error). We’ll never know.
Conclusion
- Keep a log every hour (more often in fog) so that if things go wrong with the electronics your EP will be reasonably close
- 12 hours of EP resulted in a 4 mile circle of uncertainty – over 60 miles this could easily be 10+ miles with leeway, tide errors & steering error. I think that’s quite scary
- a 1 mile circle of uncertainty after 2 hours seems high to me (I’ve double checked the tidal atlas and 3 miles is what Reeve-Fowkes Yachtsman’s Manual of Tides says)